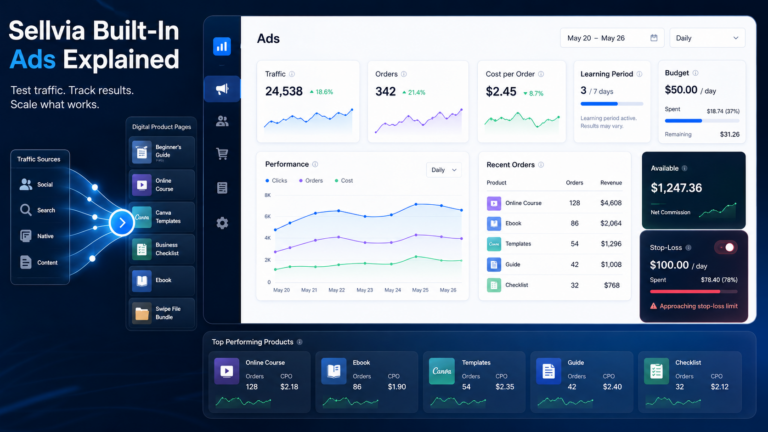

Sellvia Insights Explained: How to Use Store Data and Recommendations
Quick Answer: Sellvia Insights is best treated as a decision layer rather than a scoreboard. The useful workflow is to read traffic, orders, advertising activity, balances and operational signals together, then decide what to change next. A single number rarely explains performance on its own. The practical value comes from connecting a signal to an action, checking the result, and avoiding changes based on too little data.
Running a Sellvia store becomes much easier once the dashboard stops looking like a collection of unrelated numbers. Traffic, orders, advertising performance, balances and account activity describe different parts of the same customer journey. The purpose of an insights workflow is to turn those signals into decisions without confusing activity with progress.
This guide explains a practical way to use Sellvia store data and recommendations. It focuses on interpretation rather than promising that any individual metric will produce a specific result. The examples are decision frameworks, not guaranteed performance benchmarks.
What Sellvia Insights Means in Practice
In practical terms, an insight is a useful conclusion drawn from several pieces of store information. A traffic increase is a signal. An order increase is another signal. A change in advertising efficiency is another. The insight appears when those signals are considered together and lead to a reasonable next action.
That distinction matters because dashboards can encourage reactive decisions. A store owner may see a weak day and immediately change a campaign, product selection or budget. The opposite can happen after one unusually strong day. Both reactions can create noise. A better process is to ask what changed, where in the funnel it changed, and whether the pattern is large enough to justify intervention.
Signals are not conclusions
Think of each dashboard metric as evidence. Traffic can tell you whether people reached the store. Orders can tell you whether visits turned into purchases. Advertising data can help connect paid acquisition activity with store outcomes. Balance states tell you something different again: when earned amounts move through the platform’s financial workflow. None of these should be substituted for another.
Start With the Customer Journey, Not a Favorite Metric

A simple reading order prevents many interpretation mistakes. Begin with acquisition, continue through store activity and orders, then look at the financial result. This creates a sequence instead of a pile of numbers.
- Traffic: Did enough visitors reach the store to evaluate what happened next?
- Orders: Did store activity translate into completed customer actions?
- Advertising: If paid traffic was involved, did spend produce useful activity at an acceptable level?
- Order status: Where are orders in the operational flow?
- Balances: What portion has moved through Pending and Incoming toward Available, and what portion is affected by Risk Reserve?
This sequence also helps separate marketing problems from operational or timing issues. For example, a store can have orders while the amount visible as Available remains lower than a beginner expects because balance timing is not the same thing as order timing.
Read Traffic in Context
Traffic is the top of the observable funnel, but raw visitor volume is not a verdict on store quality. More traffic gives you more opportunities for customer actions and more evidence to evaluate, while low traffic can make downstream percentages unstable.
What to ask when traffic changes
- Was the change associated with a deliberate advertising change?
- Did order volume move in the same direction?
- Did the traffic change happen for long enough to be meaningful?
- Was there a store, product or checkout change at the same time?
- Are you comparing equivalent periods rather than a partial day with a full day?
The goal is not to explain every fluctuation. It is to identify changes that can reasonably be connected to something you did or to a repeatable pattern.
Use Orders as a Funnel Checkpoint
Orders sit between visitor activity and financial outcomes. If traffic rises but orders do not, the useful question is not simply “why are sales bad?” Break the question down. Is the traffic relevant? Is the offer clear? Are product pages understandable? Is checkout functioning as expected? Did the observation window contain enough visits to make the comparison useful?
Conversely, if orders rise while traffic stays relatively stable, that can justify examining what changed in the store or traffic mix. It does not automatically prove causation, but it gives you a focused hypothesis to test.
Do not confuse order count with cash available today
Sellvia’s order and balance workflow has timing stages. Under the current model used throughout this site, an order moves through processing and then Pending, followed by Incoming for roughly 72 hours before the eligible amount is split between Available and Risk Reserve. About 75% becomes Available while about 25% is held in Risk Reserve for roughly 125 days. That means an order signal and an immediately withdrawable balance are intentionally different measurements.
Connect Advertising Data to Store Outcomes
Advertising metrics become more useful when they are read as part of the store funnel. Impressions or clicks can describe campaign activity, but the business question is what happened after that activity reached the store. That is why the advertising dashboard and store reports should be read together rather than in isolation.
If you need a deeper walkthrough of campaign numbers, see Sellvia Ads Metrics Explained. For the controls and campaign workflow itself, see Sellvia Ads Dashboard Explained.
A useful three-question advertising check
- Did the campaign create additional relevant traffic?
- Did that traffic contribute to orders or other meaningful store activity?
- Does the result justify keeping the current setup, testing a controlled change, or reducing exposure?
That framework is intentionally simple. It keeps the decision tied to business outcomes instead of optimizing a campaign number simply because the dashboard makes it visible.
Separate Operational Data From Financial Data
One of the most important dashboard habits is recognizing that operational and financial states answer different questions. Order status tells you where customer activity is in the workflow. Balance status tells you when the related amount reaches a particular financial state.
| Signal | Main question | Typical decision |
|---|---|---|
| Traffic | Are visitors reaching the store? | Evaluate acquisition and traffic quality |
| Orders | Are visits becoming customer actions? | Review offer, product page and checkout path |
| Ad activity | What is paid acquisition producing? | Hold, test or adjust campaign settings |
| Pending / Incoming | Where is value in the processing timeline? | Plan timing rather than treat it as missing money |
| Available | What amount is currently eligible for payout? | Plan withdrawal and operating cash |
| Risk Reserve | What amount is being held for later release? | Forecast liquidity over a longer horizon |
For a detailed explanation of those financial states, use Sellvia Risk Reserve Explained and Sellvia Payouts Explained.
Use Recommendations as Hypotheses, Not Commands
Whenever a platform surfaces a recommendation, alert or suggested next step, the safest interpretation is: this is a hypothesis worth checking. A recommendation can point attention toward an area of the store, but the owner still needs to compare it with the surrounding data and current objective.
For example, a recommendation related to advertising should be considered alongside traffic and order behavior. A recommendation related to store setup should be considered alongside the actual customer journey. This prevents a useful suggestion from becoming an automatic action detached from context.
The recommendation test
- Relevance: Does the recommendation address a real constraint visible in your data?
- Control: Can you change one variable without changing several others at the same time?
- Measurement: Do you know what result would count as an improvement?
- Time: Can you give the test enough time to produce useful evidence?
- Reversibility: Can you undo the change if the result is worse?
Build a Baseline Before You Optimize
Insights become more reliable when you know what “normal” looks like for your own store. A baseline does not need to be complicated. Record the same small set of numbers at the same interval and add short notes about meaningful changes.
A weekly review is often easier to interpret than constantly reacting to live numbers. The point is not that seven days is universally correct; the point is to use a consistent comparison window. If you compare Monday morning with all of last week, the conclusion will be distorted before you even start.
A simple baseline worksheet
| Item | Record | Note |
|---|---|---|
| Traffic | Period total | Major source or campaign change |
| Orders | Period total | Product or checkout changes |
| Advertising | Spend and relevant outcome metrics | Budget or campaign adjustment |
| Available balance | Period-end amount | Remember payout timing |
| Risk Reserve | Period-end amount | Track future release expectations |
| Action taken | One primary change | State what you expect to happen |
Change One Important Variable at a Time
If you change the campaign, product selection, page copy and budget at the same time, a better result does not tell you which change helped. A worse result is equally difficult to diagnose. Controlled iteration is slower emotionally but faster analytically because each test teaches you something.
Start with the largest plausible constraint. Make one meaningful change. Record the date. Define the metric or behavior you expect to improve. Then compare an appropriate period after the change with the baseline. This turns the dashboard into a learning system.
Example: Traffic Rises but Orders Stay Flat
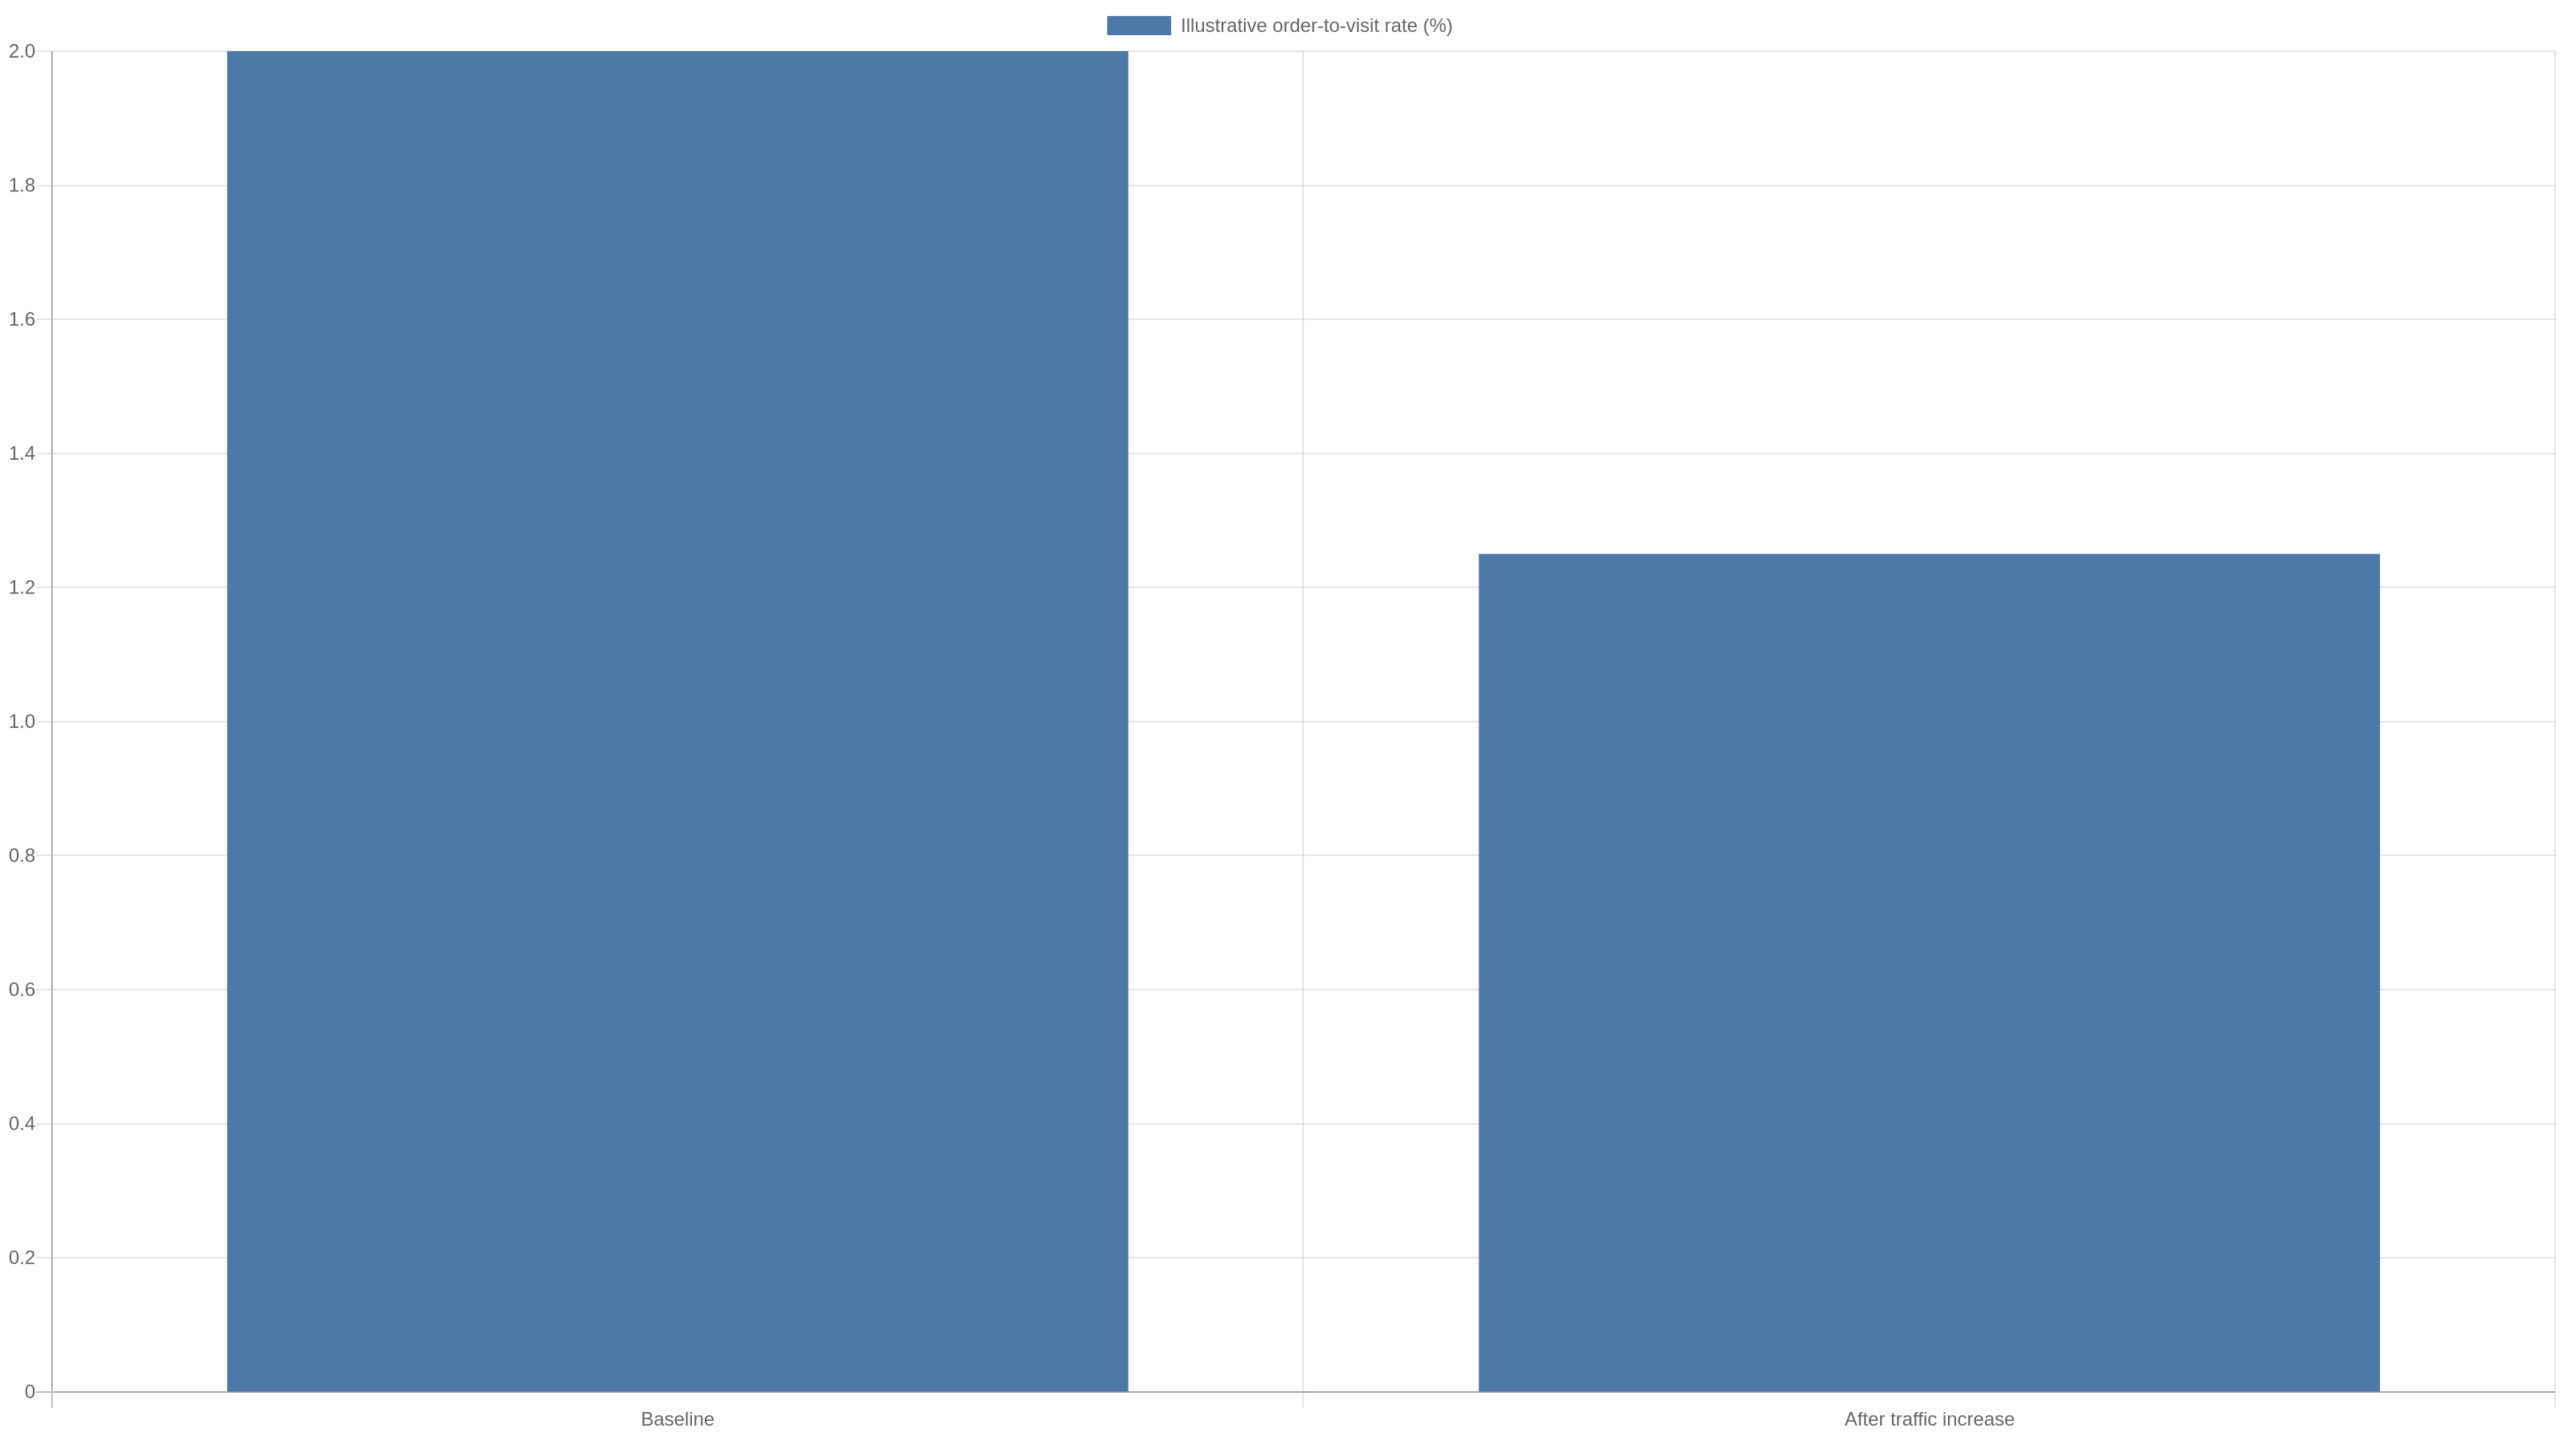
Suppose a store normally receives 500 visits in a comparison period and 10 orders. After an advertising adjustment, it receives 800 visits and still gets 10 orders. Those numbers are illustrative, not a Sellvia benchmark.
The weak interpretation is “more traffic did not work.” The better interpretation is that acquisition volume increased while the downstream outcome did not increase with it. That narrows the investigation. You can review traffic relevance, product-page clarity, offer fit and checkout behavior before increasing the budget again.
The example also shows why percentages need context. The illustrative order-to-visit ratio moved from 2.0% to 1.25%, but that does not by itself identify the cause. It simply tells you where to look next.
Example: Orders Rise but Available Balance Lags
Now imagine order activity improves and the owner expects the Available balance to rise immediately by the same amount. That expectation ignores the platform’s financial timeline. Pending and Incoming stages, the approximate 72-hour Incoming period, and the 75% / 25% Available-to-Risk-Reserve split all affect when value appears in each balance state.
The insight here is not a marketing conclusion at all. It is a cash-flow conclusion: store performance and withdrawable cash should be tracked on separate timelines. This is especially important when planning advertising or other operating expenses.
Example: One Strong Day Creates a False Signal
A single strong day can make a campaign, product or store change look more successful than it really is. Small samples are noisy. If the underlying traffic volume is low, one or two additional orders can dramatically change a percentage.
Instead of immediately scaling based on one observation, mark the event and watch whether the pattern repeats. If it does, the signal becomes more useful. If it disappears, you avoided making a larger decision from a temporary spike.
How the Sellvia Dashboard Sections Work Together
The dashboard becomes more useful when each section has a defined role. The account area provides subscription, billing, balance and payout context. Orders provide workflow context. Reports and advertising metrics provide activity and performance context. None needs to carry the entire analytical burden.
For a broader map of the interface, see Sellvia Dashboard Overview. For account-specific controls, see Sellvia My Account Explained. Those guides are useful companions because they explain where information lives; this article focuses on what to do with it.
A Practical Weekly Insights Routine
- Choose one consistent comparison period. Avoid mixing partial and complete periods.
- Check traffic first. Note material acquisition changes.
- Check orders second. Determine whether downstream activity moved with traffic.
- Review advertising in context. Connect paid activity to store outcomes rather than judging campaign metrics alone.
- Review order and balance states. Separate operational progress from financial availability.
- Read recommendations and alerts. Treat them as hypotheses to validate against your objective.
- Select one primary action. Prefer a controlled change over several simultaneous changes.
- Write down the expected result. This makes the next review less subjective.
- Do not rewrite the plan mid-test without a reason. Give the change enough evidence to evaluate.
Common Insights Mistakes
Watching only revenue-related numbers
Financial outcomes matter, but they are downstream. If you ignore traffic and orders, you lose the clues that explain why the financial result changed.
Treating every fluctuation as a trend
Daily numbers move. A trend requires repeated evidence. Use consistent periods and annotate major changes before deciding that a new pattern exists.
Changing too many things at once
Simultaneous changes destroy attribution. Even when the result improves, you may not know what to repeat.
Ignoring balance timing
Orders, Incoming, Available and Risk Reserve are not interchangeable. Use the appropriate state for the question you are trying to answer.
Following a recommendation without checking context
A recommendation can focus your attention, but it should still be evaluated against the store’s current data, objective and constraints.
What to Track Without Building a Complicated Spreadsheet
You do not need a large analytics system to become more disciplined. A compact log can contain the date range, traffic, orders, relevant ad activity, Available balance, Risk Reserve balance, one major change and one short conclusion. The value is consistency.
If the store grows and decisions become more complex, you can add more detail later. Starting with dozens of metrics often creates reporting work without improving decisions. Track a number because it changes what you do, not because it exists.
Decision Checklist Before You Make a Change
- Am I comparing equivalent time periods?
- Is the sample large enough to justify a conclusion?
- Did traffic, orders and financial states move together or separately?
- Was there another change that could explain the result?
- What exact problem am I trying to solve?
- What single change would test my hypothesis most clearly?
- What result would make me keep, reverse or revise the change?
- Am I confusing a processing delay with a performance problem?
FAQ
What is the most important Sellvia metric to watch?
There is no single universal metric. The useful metric depends on the decision. Traffic is useful for acquisition questions, orders for funnel questions, advertising data for paid acquisition questions, and balance states for cash-flow questions.
Should I react to daily changes?
Usually, a daily change is better treated as a signal to investigate than automatic proof that something needs to be changed. The appropriate observation window depends on traffic volume and the decision being tested.
Why can orders improve before Available balance does?
Because the operational order timeline and the financial balance timeline are different. Under the current Sellvia model described on this site, amounts can move through Pending and Incoming before the eligible split reaches Available and Risk Reserve.
How should I use Sellvia recommendations?
Use them as prompts for investigation. Check whether the recommendation matches a constraint visible in your store data, decide what outcome you expect, and make a controlled change when possible.
Do I need external analytics to use this workflow?
No. The basic workflow is about disciplined interpretation of the information already available to you. External analytics can add detail, but the core habit is connecting acquisition, orders, operational states and financial states before making decisions.
How to Distinguish a Useful Signal From Dashboard Noise
A useful signal has context, persistence and a plausible connection to something in the customer journey. Dashboard noise is movement that looks important because it is recent or visually prominent but does not yet provide enough evidence for a decision. This distinction is especially important for a smaller store, where a handful of visits or orders can move percentages sharply.
Use three filters. First, ask whether the change is large relative to the store’s normal range. Second, check whether a related metric moved in a way that makes sense. If traffic increased, did orders or another downstream signal respond? Third, look for a plausible event: a campaign adjustment, a new product, a page change or a different comparison period. A movement that passes all three filters deserves more attention than a number that changed by itself.
This does not mean waiting indefinitely before acting. It means matching the size of the action to the strength of the evidence. Weak evidence may justify checking the store or watching another period. Stronger repeated evidence may justify a controlled test. A clear operational problem can justify immediate correction. The dashboard is most useful when it helps you choose the appropriate level of response.
Keep Marketing Decisions and Cash-Flow Decisions Separate
Sellvia data can support two very different types of decisions. Marketing decisions ask whether traffic acquisition and the store funnel are producing useful customer activity. Cash-flow decisions ask how much money is available, when additional amounts are expected to become available, and how much operating room the store has. Mixing the two can produce unnecessary confusion.
For example, a marketing test may look encouraging because order activity improved. That does not automatically mean the same amount can immediately fund the next advertising cycle. The Pending and Incoming timeline, the Available balance, Risk Reserve and payout rules all matter to liquidity. A store owner can therefore have a positive marketing signal and a temporary cash-flow constraint at the same time.
When reviewing Insights, label the decision before looking for the answer. If the question is whether to keep a campaign change, focus on acquisition and order evidence. If the question is whether the store can fund the next cycle from currently accessible cash, focus on Available balance and the expected timing of amounts still moving through the financial workflow.
Create a Short Decision Log
A decision log is one of the simplest ways to make recommendations and dashboard data more useful over time. For every meaningful change, write down the date, the problem you saw, the evidence you used, the action you took and the result you expected. At the next review, add what actually happened.
This solves a common problem: memory tends to rewrite the reason for a decision after the outcome is known. A short written record preserves the original hypothesis. It also makes repeated mistakes easier to spot. If several changes were made after short-lived fluctuations and none produced a durable improvement, the pattern itself becomes an insight.
The log can stay deliberately small. One sentence per decision is enough. The goal is not administrative documentation; it is to create continuity between one dashboard review and the next. Over time, that history becomes more valuable than repeatedly starting from the latest number with no record of what changed before it.
Takeaway
Sellvia store data is most useful when it is read as a connected system. Start with traffic, follow the path to orders, review advertising in context, and keep order status separate from balance availability. Treat recommendations as hypotheses, establish a baseline, change one important variable at a time, and record what you expect to happen.
The objective is not to predict every movement in the dashboard. It is to make fewer impulsive changes and more decisions that can be explained, tested and repeated.

Jeck Palmer is an ecommerce writer and platform researcher at Sellvia.info. He specializes in analyzing Sellvia’s features, pricing, tools, advertising system, order workflow, and overall business model. His articles are designed to explain complex platform processes in clear and practical language, helping beginners understand potential costs, evaluate available tools, and make more informed decisions before starting an online business.