
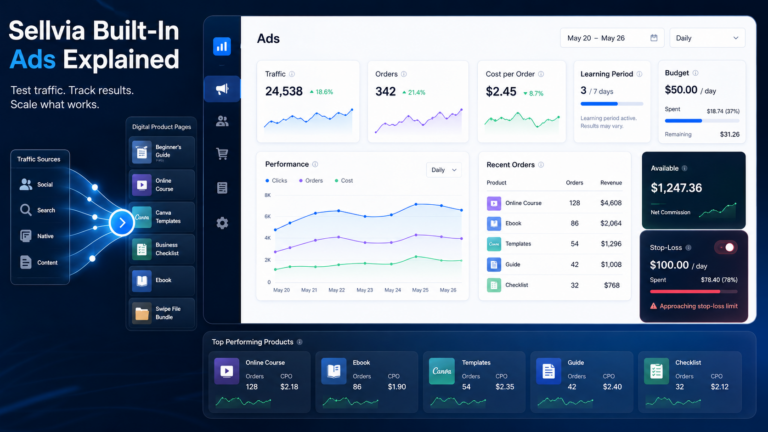
Sellvia Ads Dashboard Explained: Campaign Controls and Performance Data
Quick Answer: The Sellvia Ads dashboard is the control area for starting, funding, monitoring, and adjusting built-in advertising for a digital-product store. Read it as a workflow: confirm the campaign is active, check advertising credit and daily budget, watch traffic and order signals over several days, then use the data to decide whether to keep testing, pause, or change direction. One day of traffic or one order is not enough to judge a campaign.
Sellvia currently markets built-in advertising as a way to launch promotion from the same environment used to manage the store, and its current public offer advertises a $40 introductory ad credit. That convenience does not make advertising automatic profit: the dashboard gives you controls and performance signals, but you still have to understand what those signals mean and how much money is being committed.
What the Sellvia Ads dashboard is for
The Ads area sits between your digital-product catalog and the orders that eventually appear in the account. You choose to promote the store, the campaign sends visitors, some visitors may place orders, and the dashboard gives you a place to monitor that activity. It connects directly to the wider Sellvia dashboard workflow, the Orders area, and account billing and balance records.
Sellvia’s current public signup pages describe the advertising system as built into the platform and say users can choose a daily budget after the introductory credit. Exact controls and labels can change as the product is updated, so this guide focuses on operating logic rather than pretending every account shows an identical screen.
| Dashboard area | What it answers | What to check |
|---|---|---|
| Campaign status | Is advertising actually running? | Active, paused, learning, stopped, or another current status |
| Ad balance / credit | How much promotional or paid advertising value is available? | Remaining credit, paid balance, expiry or conditions where shown |
| Daily budget | How much can be spent per day? | Current unlocked level and whether it matches your plan |
| Traffic | Are campaigns bringing visitors? | Trend over time rather than one isolated day |
| Orders | Is traffic producing purchases? | Order count, timing, and relationship to campaign activity |
| Performance data | Is efficiency improving or deteriorating? | Spend, orders, cost per order and other metrics shown in your account |
Start with campaign status, not the revenue number
The first question is simple: is the campaign running? Beginners often jump directly to orders or revenue and forget that a paused, stopped, or not-yet-active campaign cannot be expected to generate new paid traffic. Open the Ads area and identify the current campaign state before interpreting any performance number.
If the dashboard shows a learning or optimization state, treat that as a signal that the system is still collecting information. Do not assume the first few hours are representative of long-run performance. Conversely, if a campaign has been active for a meaningful period but traffic remains absent, that is a different troubleshooting problem from receiving traffic without orders.
Understand the $40 introductory advertising credit
Sellvia’s current public offer advertises a $40 ad credit for eligible new accounts. Promotional credit should be treated as advertising value, not cash. It is not the same thing as commission in the Available balance, and it is not a payout.
The practical reason to separate these balances is that they answer different questions. Ad credit answers, “How much promotional advertising value can I use?” The Available balance answers, “How much cleared commission is eligible to count toward a payout?” Mixing the two makes budgeting and performance analysis confusing.
When the dashboard shows promotional credit, check any conditions and expiry information attached to the promotion. Sellvia’s public advertising-credit terms state that promotional credits have no cash value and are applied to eligible advertising rather than withdrawn.
How the daily budget progression works
The established current operating model uses staged daily advertising levels. The sequence used for planning is $10 per day initially, $15 after 5 days, $20 after 10 days, $30 after 20 days, and $50 after 30 days. Treat the dashboard as the final authority for what is currently unlocked in your own account.
| Stage | Daily level | Operational meaning |
|---|---|---|
| Initial | $10/day | Starting point for collecting early campaign data |
| After 5 days | $15/day | More traffic capacity once the first stage has run |
| After 10 days | $20/day | A larger test budget, not a guarantee of better efficiency |
| After 20 days | $30/day | A meaningfully higher cash commitment |
| After 30 days | $50/day | Highest established daily level in the current progression |
A modeled first-30-day spend following that progression is roughly $625. That is a budgeting example, not a promise that an account will spend exactly that amount or produce a particular number of orders.
Traffic is the first performance signal
Once the campaign is active, traffic tells you whether paid promotion is actually sending people to the store. It does not tell you whether the campaign is profitable. A traffic increase with no orders is still useful information because it narrows the problem: the campaign is generating visits, but something later in the funnel is not converting.
Look at traffic over a meaningful date range. A single day can be noisy. Campaign learning, product selection, audience response, and budget changes can all distort a short window. If the dashboard offers date filters, compare like-for-like periods whenever possible.
Orders are a conversion signal, not the final profit number
Orders tell you that at least some visitors moved from browsing to purchasing. That is important, but an order count by itself does not answer whether advertising is economically successful. You still need to understand the commission generated by those orders, the cost of advertising, and the processing obligations attached to the orders.
When a purchase appears, use the Sellvia Orders dashboard to inspect its status and required actions. Ads explains how customers reached the store; Orders explains what happened after a customer bought.
Cost per order connects ads to economics
If the dashboard shows advertising spend and attributable orders, cost per order is one of the most useful derived metrics. The basic formula is advertising spend ÷ number of orders. For example, $60 of ad spend producing 4 orders implies a $15 advertising cost per order.
That number is not automatically good or bad. It becomes useful only when compared with commission and other costs. The key lesson is to avoid reading “4 orders” as success without the spend context.
Why campaign controls and performance data belong together
The dashboard becomes useful when controls and results are read as a loop. A budget setting changes exposure. Exposure changes traffic. Traffic may create orders. Orders create data about efficiency. That data informs the next budget or campaign decision.
- Confirm the campaign is active.
- Record the current daily budget and available ad credit.
- Allow enough time to collect a useful sample.
- Review traffic and orders over the same date range.
- Compare spend with resulting order volume.
- Check Orders for processing status.
- Decide whether to continue, pause, or change the test.
Traffic but no orders: what to inspect
If traffic is arriving but orders are not, do not immediately assume the advertising system is broken. The campaign has already demonstrated that it can deliver visits. The next questions concern the store and offer: are the promoted digital products relevant, is the product page clear, does the price make sense, and does checkout work?
Open the storefront as a customer and test the journey. Review the product page, navigation, pricing, trust information, and checkout flow. The Sellvia My Store guide covers the customer-facing side of that inspection.
Orders but rising spend: what it means
A campaign can generate orders and still become less efficient. If spend rises faster than order volume, cost per order increases. That does not automatically mean the campaign should be stopped, but it does mean the order count should not be celebrated without context.
Compare consistent periods. If one seven-day window spent $70 for seven orders and the next spent $105 for seven orders, the second period bought the same order volume at a higher acquisition cost. That is a signal to investigate, not a guarantee that future performance will continue in the same direction.
How to use the dashboard during the first week
During the first few days, the objective should be observation and clean recordkeeping rather than constant intervention. Record the campaign start date, daily budget, promotional credit, traffic, orders, and any status changes. If you change the budget or pause the campaign, record the time.
A simple log prevents hindsight errors. Without it, a user may remember that “ads were running all week” when the campaign was actually paused for two days, or compare an order total against the wrong spend period.
| What to record | Why it matters |
|---|---|
| Date and time | Aligns campaign changes with later traffic and orders |
| Campaign status | Shows whether paid traffic was active |
| Daily budget | Explains changes in potential spend |
| Ad credit / paid balance | Separates promotional value from your own funds |
| Traffic | Shows whether the campaign is delivering visitors |
| Orders | Shows whether visits are turning into purchases |
| Notes | Captures changes that could affect results |
Do not confuse the Ads dashboard with billing
The Ads dashboard is where you monitor advertising activity. Billing records answer a different question: what was charged, when, and for which service? If you are reconciling a card charge or subscription renewal, use the records described in Sellvia Billing Explained.
Sellvia has multiple money flows: the base subscription, advertising spend, order processing, commission balances, Performance Tiers, and payouts. An advertising number should not be interpreted as a subscription charge, and promotional credit should not be interpreted as withdrawable earnings.
Common mistakes when reading Sellvia Ads
Judging a campaign after one day
One day is a tiny sample. Use a longer period unless there is an obvious operational problem.
Looking at orders without looking at spend
Order volume is incomplete without acquisition cost. Always pair the two.
Looking at traffic without testing the store
If visitors arrive but do not buy, inspect the customer journey rather than repeatedly changing the campaign.
Treating promotional credit as cash
Advertising credit is restricted promotional value. It is not an Available balance and cannot be treated as payout money.
Increasing budget before understanding the baseline
More spend can produce more data, but it also increases the amount at risk. Establish what the lower level is doing first.
Changing multiple variables at once
If you change product mix, budget, storefront and campaign state simultaneously, later results are difficult to interpret.
A practical Ads dashboard checklist
- Confirm the correct store/account.
- Check whether the campaign is active, paused, learning, or stopped.
- Record the current daily budget.
- Record promotional credit and paid advertising balance separately.
- Use a consistent date range for traffic, spend and orders.
- Check whether traffic increases while ads are active.
- Compare orders with advertising spend.
- Open Orders for purchases that need processing.
- Test the storefront if traffic arrives without orders.
- Keep a dated log of campaign changes.
- Verify current controls in your own dashboard before relying on an older screenshot.
FAQ
What is the Sellvia Ads dashboard?
It is the advertising control and monitoring area inside the Sellvia account, used to manage built-in promotion, review advertising credit and budget information, and monitor campaign-related performance signals.
Does Sellvia include free advertising?
Sellvia’s current public offer advertises a $40 introductory ad credit for eligible accounts. It is promotional advertising value, not cash and not a payout balance.
What daily ad budget should I expect?
The established current progression starts at $10 per day and unlocks higher levels over time: $15 after 5 days, $20 after 10 days, $30 after 20 days and $50 after 30 days. Your live dashboard is the final authority.
Does more traffic mean the campaign is working?
It means the campaign is delivering visitors. Whether it is working economically depends on what those visitors do, how many orders result, and how much spend was required.
Where do I see what happened after an order?
Use the Orders section. Ads explains acquisition activity; Orders shows the purchase and processing workflow.
Should I increase the budget as soon as I get an order?
Not automatically. One order is a small sample. Review spend, traffic, order volume and the time period together before changing budget.
Takeaway
The Sellvia Ads dashboard is most useful when you treat it as a decision loop rather than a scoreboard. Start with campaign status and budget, separate promotional credit from your own funds, watch traffic and orders over the same period, and connect every advertising result back to Orders and billing. The dashboard can make campaign management simpler, but it cannot make the judgment for you. Clean records, consistent date ranges, and small deliberate changes are what turn activity into information you can actually use.

Jeck Palmer is an ecommerce writer and platform researcher at Sellvia.info. He specializes in analyzing Sellvia’s features, pricing, tools, advertising system, order workflow, and overall business model. His articles are designed to explain complex platform processes in clear and practical language, helping beginners understand potential costs, evaluate available tools, and make more informed decisions before starting an online business.
One Comment