
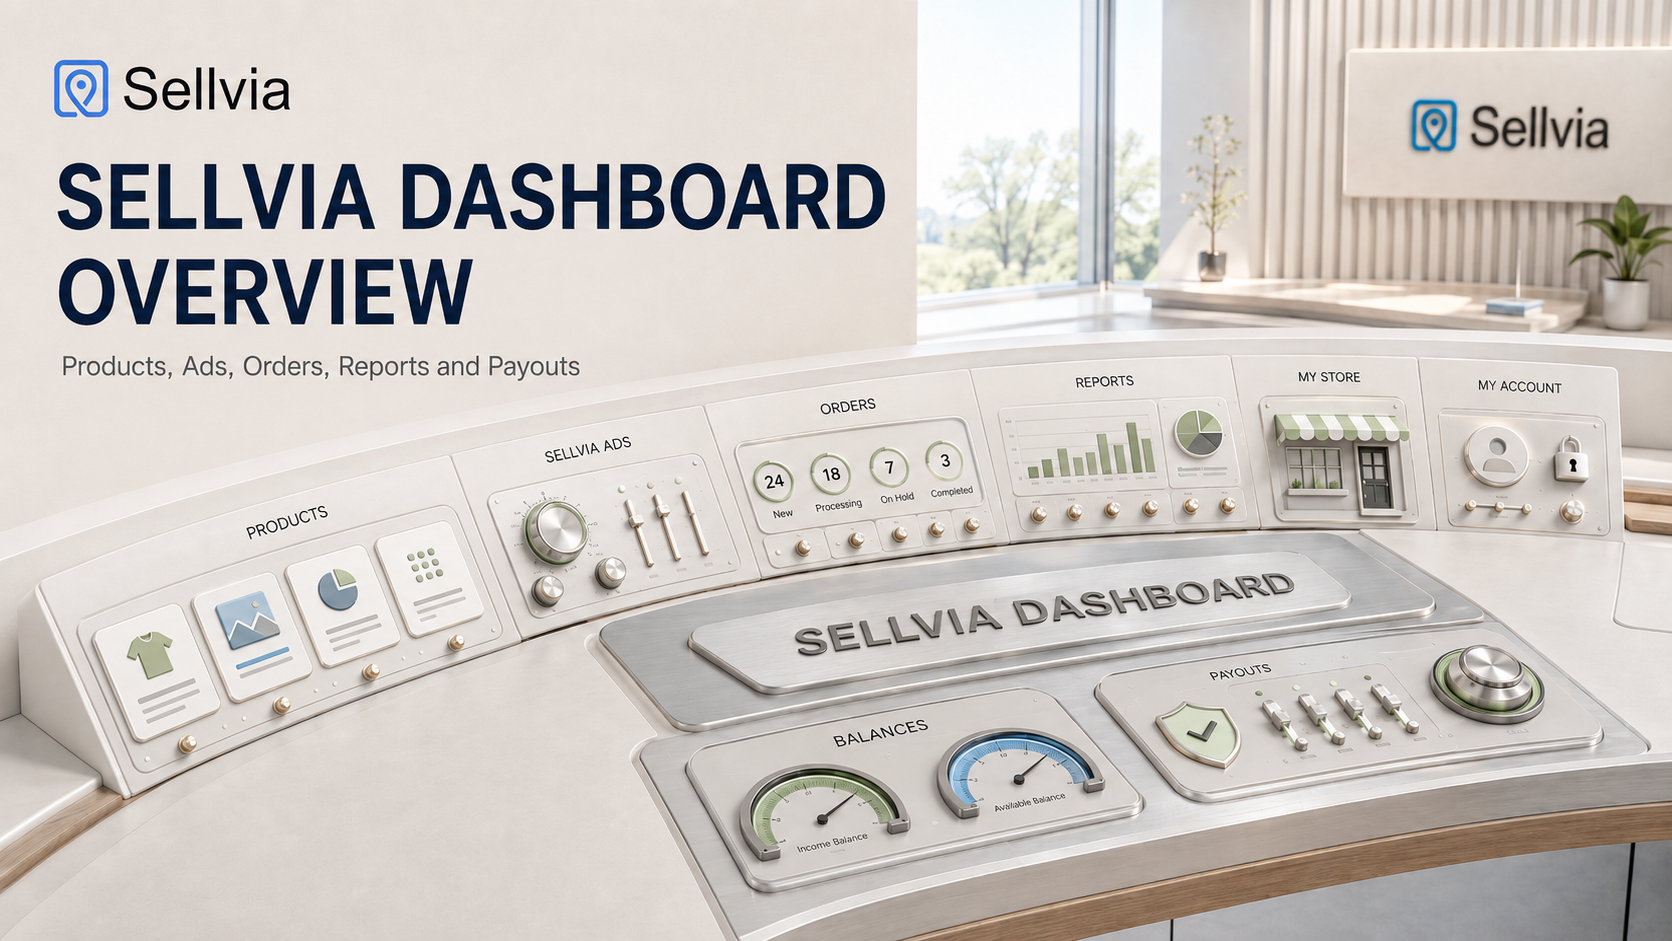
Sellvia Dashboard Overview: Features, Orders, Ads and Payouts
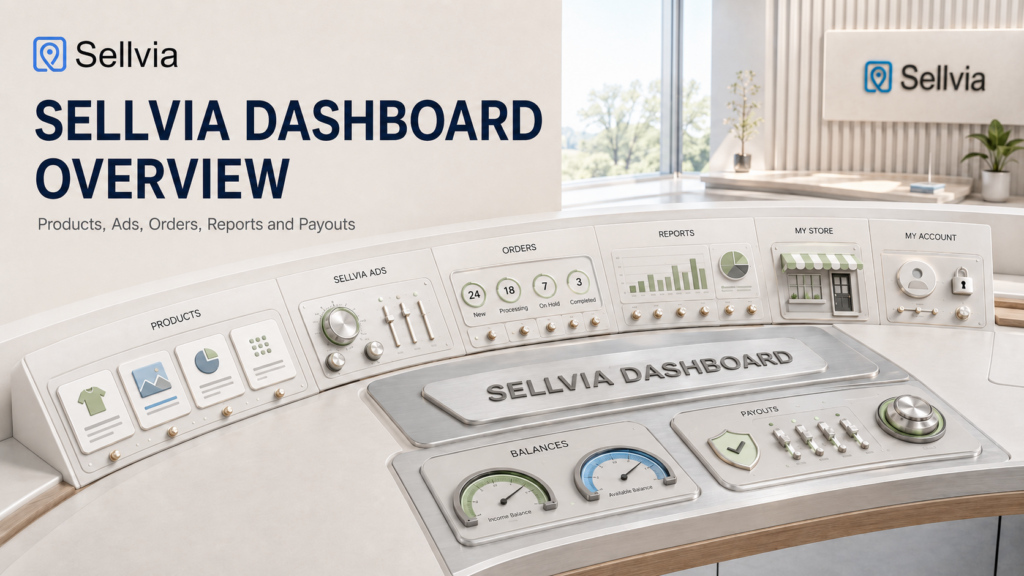
A section-by-section walkthrough of how the Sellvia dashboard organizes products, advertising, orders, reports, and balances into one operating rhythm.
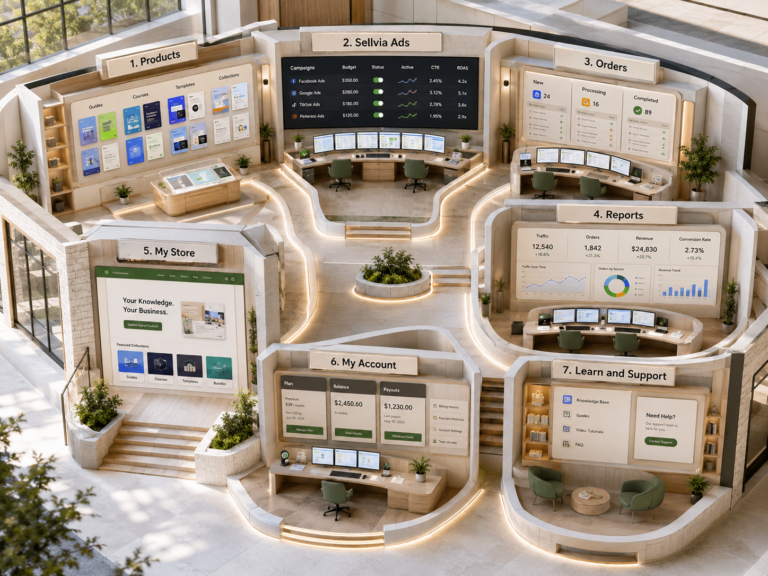
The Sellvia dashboard is the control room where a ready-made online store actually gets operated day to day. Once a store is created, the dashboard becomes the single place where a beginner reviews products, checks advertising activity, processes orders, reads reports, and tracks how money moves from a sale to an available balance. Instead of switching between a store backend, an ad account, a spreadsheet, and a payment portal, the Sellvia dashboard tries to bring these functions into one connected workspace.
This overview does not repeat a general explanation of what Sellvia is or how the platform works at a conceptual level. For that context, an independent Sellvia guide and a separate breakdown of how the Sellvia workflow operates are already available. This article is narrower. It focuses on the dashboard itself: what appears on each screen, what business decision each screen supports, and how often a beginner should actually look at it.
The dashboard’s real value is not the number of menu items it contains. Its value comes from how those sections connect to each other. A product decision affects what appears in Orders. An advertising decision affects Reports. A processed order affects the balance shown in My Account. Understanding those connections, rather than memorizing labels, is what separates a beginner who reacts to the dashboard from one who uses it to run a business.
Sellvia Dashboard Overview: Quick Answer
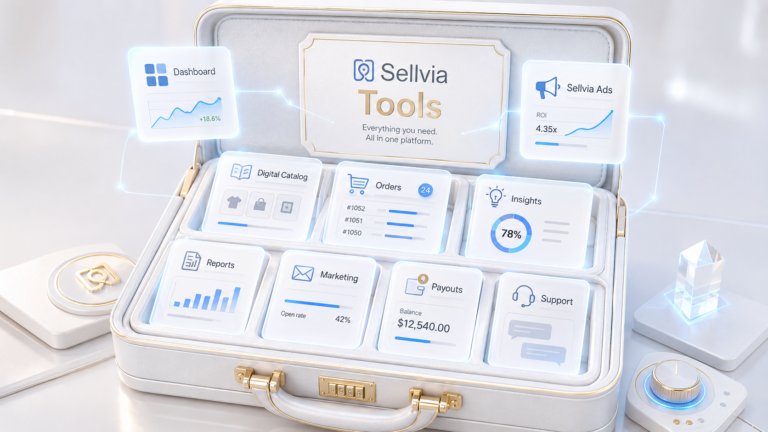
The Sellvia dashboard is the account portal where a store owner manages products, advertising, orders, reports, and financial balances after signing up for the platform. Official Sellvia dashboard documentation describes a structure organized around sections such as Home, Products, Orders, Sellvia Ads, Reports, Insights, My Store, and My Account, though the exact layout a given user sees can vary. It centralizes several tasks that would otherwise require separate tools: a product catalog manager, an advertising console, an order tracker, and a payment ledger. For a beginner, this matters because it reduces the number of places information can get lost or misread.
The dashboard organizes information but does not make decisions on its own. It shows which orders need processing, how advertising is performing, and how earnings move through Pending, Incoming, Available, and Risk Reserve stages, but the user still has to process orders, fund applicable costs, interpret the numbers, and decide when to scale advertising or expand a catalog. Availability of specific menu items can vary by account, subscription, and Performance Tier, so the dashboard itself should be treated as the current source of truth rather than any external description of it, including this one.
What Makes the Sellvia Dashboard Useful?
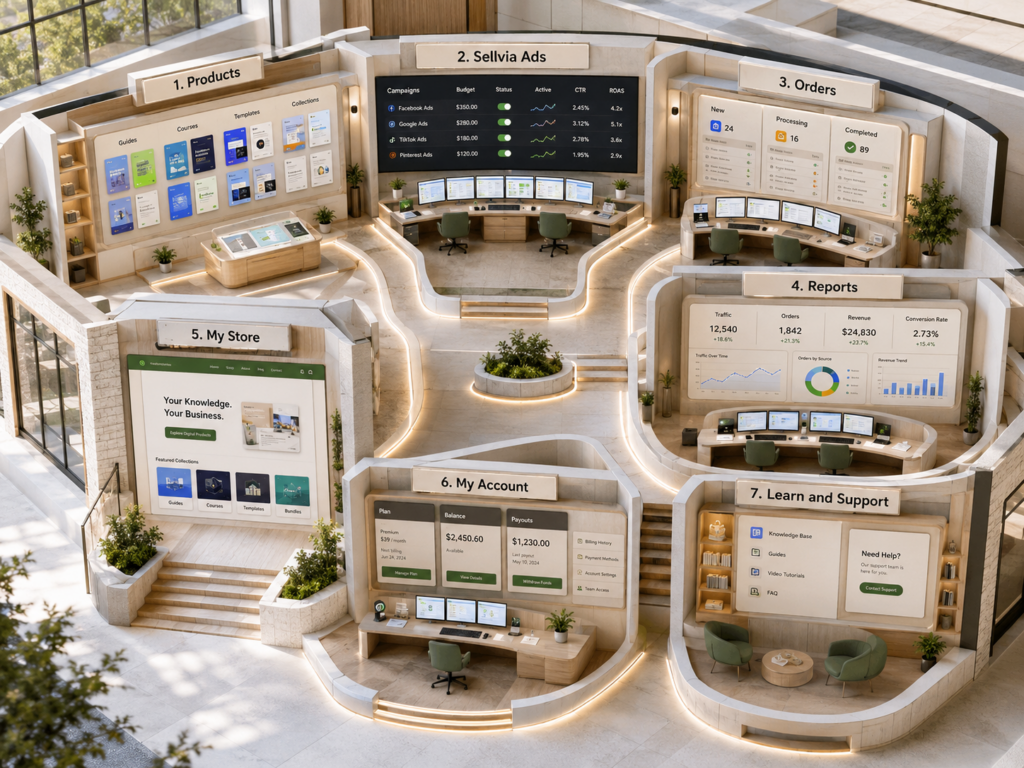
Running a small online business without a centralized dashboard usually means juggling several separate tools, each with its own login, its own terminology, and its own version of the numbers. Reconciling all of that by hand takes real time and invites mistakes. Sellvia’s dashboard reduces this by placing product management, advertising controls, order status, financial reporting, and payout information behind a single account, so a new order, the advertising spend connected to it, and the resulting balance movement can all be reviewed in the same place.
This is genuinely useful for someone with no prior ecommerce experience, since it lowers the number of interfaces they need to learn at once. It is worth being precise about what that convenience does and does not do. It does not replace the need to understand basic unit economics, and it does not turn raw activity data into a profit calculation automatically. It simply reduces how many places a beginner has to look before they can ask the right questions.
How to Access and Orient Yourself in the Dashboard
Sellvia currently uses a passwordless email-link login for the new dashboard. The user enters the email address associated with the account, clicks the button to request a login link, and then opens the secure link delivered by email. No permanent dashboard password is required for this login method.
After entering the account, confirm that the correct store is selected, especially when more than one store is connected to the same email. Then review the navigation menu, store URL, account status, and any alert that requires immediate attention.
The Home Page: What to Check First
The dashboard Home page generally functions as a summary screen rather than a working area. Depending on the account, it may include fast links to frequently used sections, the store’s live URL, a short performance summary covering a recent period, recent account activity, and any available services or upgrade offers. Some accounts also show alerts here when something needs attention, such as an unprocessed order or a billing issue.
The practical use of the Home page is triage, not analysis. A beginner should glance at it to catch anything urgent, then move into the specific section that requires action. Treating the Home page’s summary cards as a full profitability report is a common mistake, since a short activity summary rarely accounts for advertising cost, processing fees, or subscription charges.
First things to check after logging in
Products: Building a Focused Digital Catalog
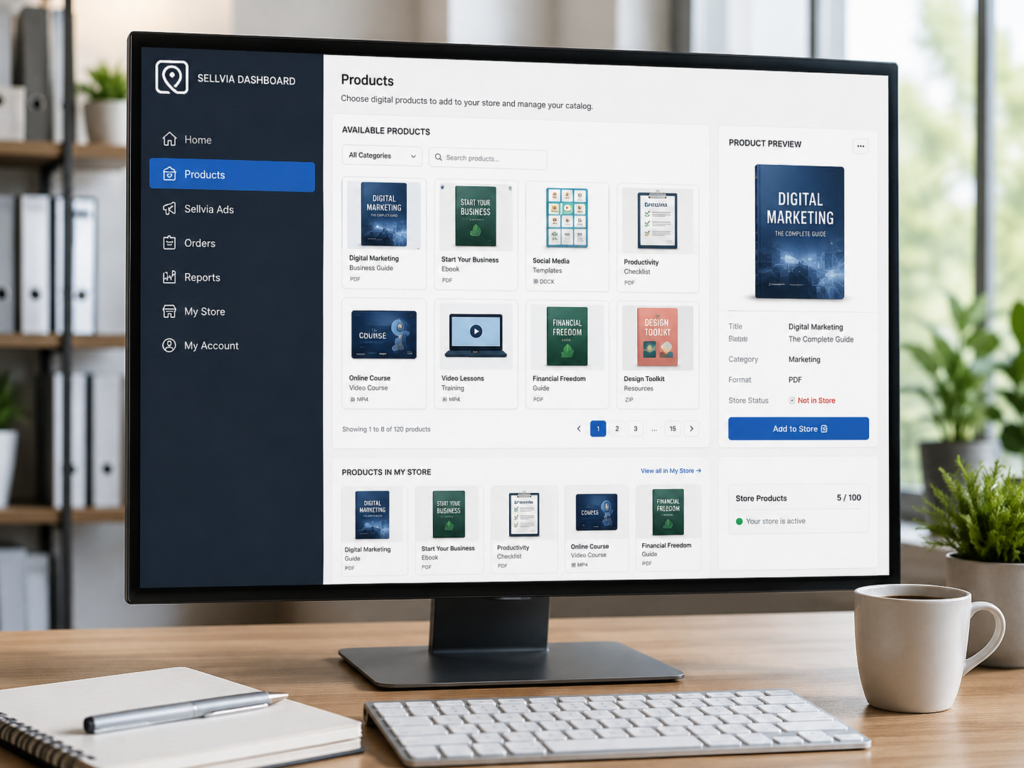
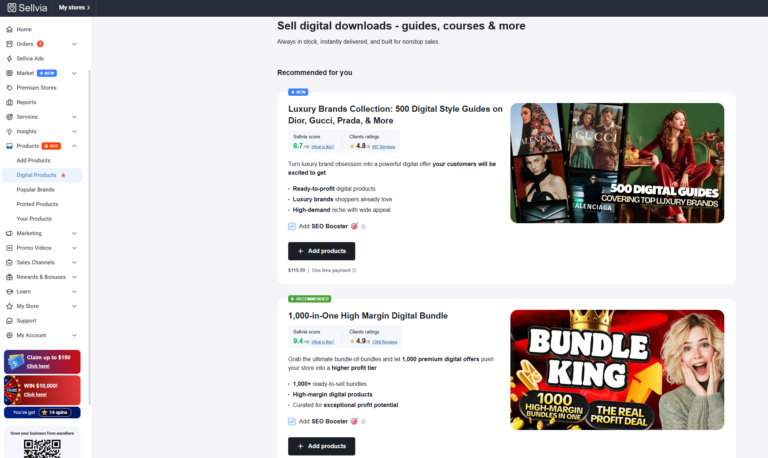
The Products section is where a store owner reviews and expands the catalog available to the account. Current Sellvia documentation describes several possible product areas, including physical products, digital products, branded items, print-on-demand products, and the store’s existing catalog. The exact packages visible can vary by store and account configuration.
For users working with Sellvia’s digital-product packages, this area may include guides, ebooks, courses, and other digitally delivered resources. The dashboard workflow remains broadly similar: review what is already installed, evaluate available packages, and add products that fit a clear store category rather than expanding the catalog without a defined strategy.
A common assumption among new users is that adding more products by itself increases sales. In practice, product availability and customer demand are two different things. A store with fifty loosely related items rarely converts better than a store with a dozen items organized around one clear theme a shopper actually understands. The dashboard makes it easy to expand a catalog, but the decision about which items to add still depends on knowing who the store is trying to serve.
A more useful approach is to treat the Products section as a curation tool rather than an import queue: review what is already listed, identify a specific niche or use case, and add items that reinforce that positioning rather than importing broadly. For a deeper explanation of how the wider product and services ecosystem fits together, see this detailed Sellvia tools overview.
Sellvia Ads: Campaign Control and Performance Monitoring
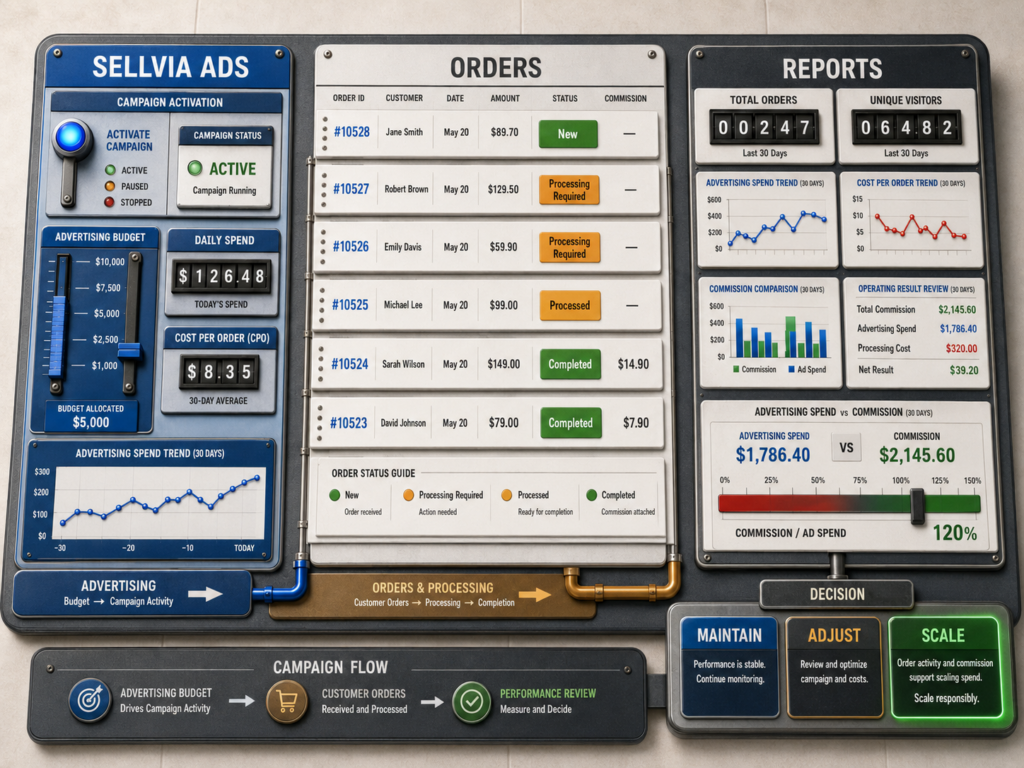
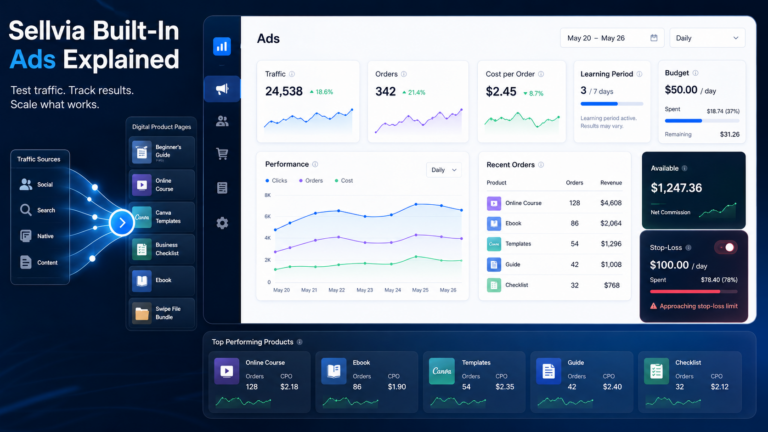
The Sellvia Ads section is where advertising activity is activated and monitored from within the dashboard, instead of through a separate Google, Facebook, or TikTok account. Depending on the account, official documentation for this area describes campaign status, available or added advertising credit, recent activity, and indicators tied to how campaigns are performing.
The dashboard’s advantage here is reducing the need to independently manage several external ad platforms, since the system is built to activate and route traffic on the store owner’s behalf. That convenience does not remove the need to interpret results. Orders measure activity. Profitability requires comparing the commission earned against complete costs, including advertising spend, applicable order processing fees, and the subscription itself.
Current documentation may describe a minimum daily advertising budget; because this figure can be adjusted, it is worth confirming directly inside the Sellvia Ads section rather than relying on a fixed number from an outside source. A full breakdown of how the built-in system works is covered separately in this Sellvia built-in advertising guide.
| Metric or Decision Input | What It Means | How to Use It |
|---|---|---|
| Ad status | Whether a campaign is active, paused, or in an early optimization stage | Confirm the campaign is actually running before expecting orders |
| Daily spend | How much advertising credit is being used per day | Compare against the budget originally set |
| Orders | How many purchases were linked to advertising activity | Look at trend over several days, not a single day |
| Cost per order | Advertising spend divided by the number of orders generated | Track whether this figure is improving or worsening over time |
| Commission | The seller’s recorded earnings before all operating costs are deducted | Compare it with advertising, processing, subscription, and other applicable charges |
| Net operating result | A user-calculated figure rather than necessarily a native dashboard field | Subtract advertising, processing, subscription, tier, and other verified operating costs from commission |
Orders: From Customer Purchase to Processing
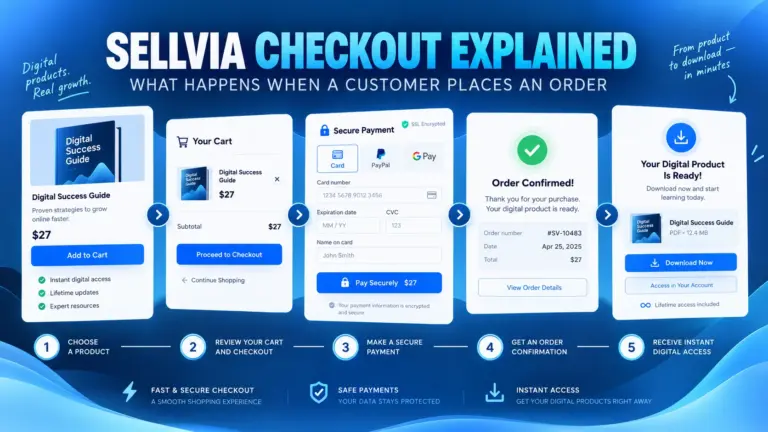
When a customer buys from the store, the purchase is synchronized into the dashboard’s Orders section. From there, a typical order record may include its status, the item purchased, commission or amount information, a processing requirement, payment status, and the order date. Exact fields can vary by account, so the current Orders screen is the most reliable reference.
The workflow generally follows a simple sequence: a customer purchase appears as a new order, the user reviews it, processing is completed, and the balance status updates as a result. It is worth separating four distinct events that are easy to blur together: an order being received, commission being recorded against that order, the order actually being processed, and the resulting funds moving through the balance stages described later in this article.
Manual order processing normally requires a saved card or another accepted card, while automatic processing can use Order Processing Credits when the credits balance is sufficient. Current official documentation also describes a final automatic attempt to process an order using Available balance before an unprocessed order is canceled after seven days. Because account behavior and dashboard rules may change, users should follow the processing options displayed in their current Orders section. Readers weighing whether these costs make sense for their situation may also want to review the Sellvia startup budget breakdown.
Reports: Measuring Traffic and Order Activity
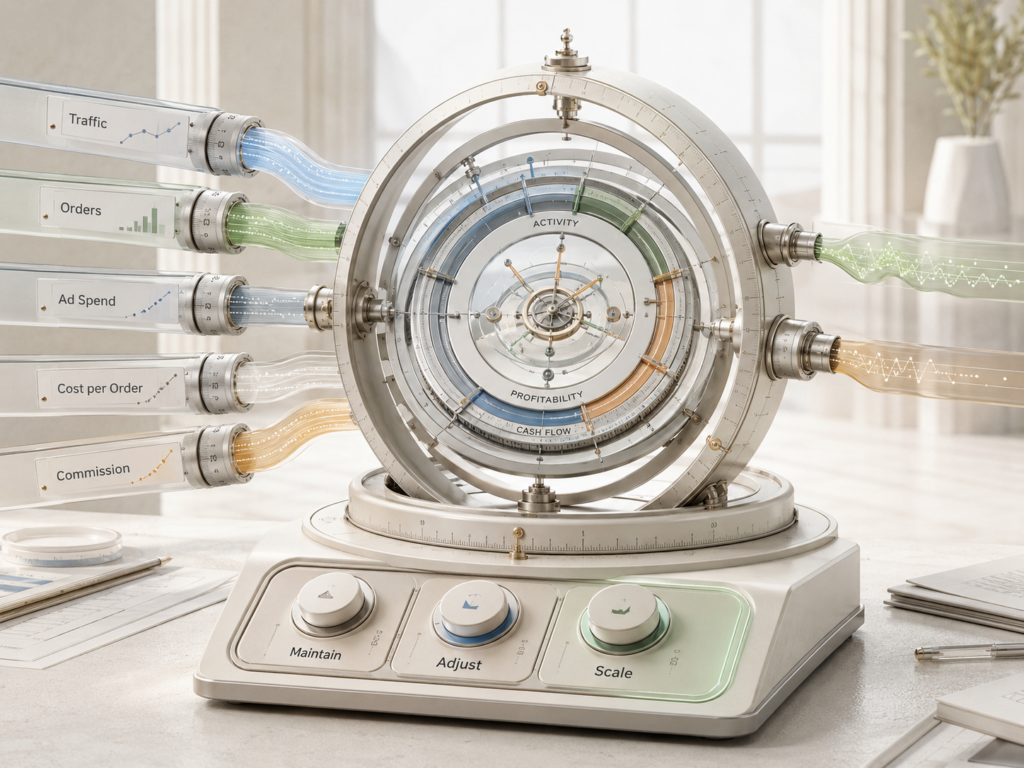
The Reports section currently focuses on high-level store activity. Official Sellvia documentation describes metrics such as Unique visitors and Total orders, together with a time filter that allows users to review performance across different periods. Users may also connect Google Analytics when they need a more detailed view of traffic behavior.
These numbers help answer two basic questions: whether people are reaching the store and whether that traffic is producing orders. They should not be treated as a complete profit statement, since advertising costs, processing expenses, subscription charges, and balance timing still need to be reviewed elsewhere.
Insights: Finding Products and Growth Opportunities
Insights serves a different purpose from Reports. Depending on the current dashboard version, it may include Best-Sellers Insights, New Hits of the Week, and a Sales Success Strategy area with account-specific recommendations. These tools are intended to help users identify product trends and possible catalog opportunities rather than measure the complete financial result of the store.
A useful way to apply Insights is to treat it as a research layer. A trending product can justify further review, but it should not automatically be added without checking whether it matches the store’s existing category, positioning, and advertising strategy.
Bringing the right questions to both areas matters more than reading the charts themselves. Is traffic increasing or decreasing over a meaningful period? Are orders growing in proportion to advertising spend, or is spend increasing faster than results? Is cost per order trending in the right direction, and is commission growing faster than total operating cost, or merely faster than advertising spend alone? A single day of data is rarely enough to answer any of these questions with confidence, since normal day-to-day variation can look like a trend when it is not. Reviewing results over a week or more, rather than reacting to one unusually good or bad day, produces a far more reliable picture of what is actually happening.
| Question | Dashboard Area | Why It Matters |
|---|---|---|
| Are ads generating orders? | Sellvia Ads and Reports | Confirms the advertising spend is producing activity, not just running |
| Is cost per order improving? | Sellvia Ads | Shows whether advertising efficiency is trending in the right direction |
| Which products attract demand? | Insights and Products | Helps focus catalog decisions around what customers actually want |
| Is commission exceeding operating cost? | My Account | The core test of whether the store is actually profitable |
| Are funds becoming Available? | My Account balances | Confirms earnings are progressing toward withdrawable status |
My Store: Connecting Management with the Live Storefront
My Store is generally the bridge between the operational dashboard and the customer-facing storefront a visitor actually sees. Depending on the account, this section may allow opening the live store directly, reviewing its current status, checking the connected domain, and adjusting presentation settings such as theme or layout details.
The distinction worth keeping in mind is that the dashboard is the management layer, while the store itself is the customer-facing layer. A setting changed in the dashboard, such as a product being removed or a domain being updated, is typically reflected on the live store shortly afterward. Because design functionality can be more limited than a dedicated website builder, this section should be treated as a way to manage an already-built store rather than as an open-ended design studio.
My Account: The Financial Control Center
My Account is where the business side of the dashboard concentrates. It is commonly organized into four areas: Home, which summarizes balances, recent activity, and available financial actions; Billing, which records outgoing payments such as subscription charges, credit purchases, and service fees; Payouts, which covers withdrawal requests, available methods, associated fees, and their current status; and Plans, which shows subscription details, renewal information, and the account’s current Performance Tier.
Billing and Payouts are frequently confused, so the distinction is worth stating plainly: Billing records money the account has paid out for subscriptions, credits, plans, or optional services, while Payouts records withdrawals or transfers made from eligible Sellvia funds toward the user. One tracks spending, the other tracks earnings leaving the platform toward the user’s own account.
| My Account Page | Information Shown | Best Time to Review |
|---|---|---|
| Home | Balance summary and recent financial activity | Daily when orders are active |
| Billing | Subscription charges, credit purchases, service fees | Weekly, or whenever a new charge appears |
| Payouts | Withdrawal requests, methods, fees, statuses | Whenever requesting a payout |
| Plans | Current subscription, renewal date, Performance Tier | Monthly, or before a renewal date |
Understanding Sellvia Balances
Pending→Incoming→AvailableRisk Reserve
Several balance labels appear across the dashboard, and confusing them is one of the most common mistakes a beginner makes. Total earnings generally reflects gross sales activity and should not be treated as profit or as money ready to withdraw. Commission balance can combine funds sitting at several different stages at once, which means it is often larger than the amount actually available for use.
Pending is generally associated with orders that have not yet completed the required processing step. Incoming refers to funds that have entered a temporary holding period after processing is complete. Available is the portion currently eligible for permitted uses or for payout, subject to whatever minimums and rules currently apply to the account. Risk Reserve is a portion held temporarily to help cover potential disputes, refunds, or adjustments; it is not presented as an operating purchase or service charge, although its eventual release may remain subject to refunds, disputes, adjustments, and current reserve rules.
Where currently documented, Incoming funds may involve a holding period of roughly 72 hours before a portion becomes Available and the remaining portion moves into Risk Reserve, with reserve funds sometimes held for a considerably longer stretch before automatic release. Official documentation on this process also references a minimum balance before a payout can be requested. These specifics can change, so confirming the current percentages, timelines, and minimum payout thresholds inside My Account is a more reliable step than relying on a fixed figure from any outside source, including this one.
A practical way to think about it: a Commission balance of a given size does not mean that entire amount is ready to spend or withdraw today. Part of it may still be Pending, part may be sitting in Incoming, part may already be Available, and a smaller part may be sitting in Risk Reserve. Reviewing Available specifically, rather than the total Commission figure, gives a far more accurate picture of what can actually be used right now.
Billing, Fees, Plans, and Performance Tiers
Subscription charges, credit purchases, and service fees are recorded in Billing, while the current subscription plan and applicable Performance Tier are shown under Plans. Because fees, tier thresholds, and included tools can be adjusted by Sellvia over time, the dashboard itself should be treated as the current source of truth rather than any fixed figure published elsewhere, including in this article.
Performance Tiers are not automatically relevant to every account, and tier eligibility is not necessarily determined by a single order count in isolation. The Plans page is the most reliable place to confirm which tier currently applies, what it costs, what order allowance or tools it includes, and when the next renewal or billing event will occur. Readers who want a broader breakdown of subscription and cost structures can review the separate Sellvia pricing structure guide rather than relying on this overview for exact figures.
Learn, Marketing, Rewards, Services, and Support
A handful of dashboard sections serve supporting rather than core operational roles. Learn generally houses tutorials, operating guides, and marketing education aimed at helping a beginner use the platform correctly. Marketing and Promo Videos may provide promotional assets or content tools that support store marketing efforts. Rewards and Bonuses can surface account-specific offers or milestones. Services typically lists optional packages, often involving separate costs, that may support further store development. Support is the appropriate place to request help when documentation and dashboard information are not enough to resolve a question.
Not every optional tool listed in these sections is necessary to run a store successfully, and reviewing the associated cost before purchasing any add-on service is a reasonable habit for a beginner account.
Market and Business Valuation
Some accounts may show marketplace-related features, including store-buying or store-selling options and an estimated business valuation figure. Eligibility for these features is not universal across all accounts, and an estimated valuation shown in the dashboard should not be treated as a guaranteed sale price, as cash already received, or as a formal independent appraisal. Where these sections appear, they are best treated as a secondary, longer-term consideration rather than part of day-to-day store operation.
A Practical Sellvia Dashboard Routine
Daily dashboard routine
A short daily check, often around five to ten minutes, typically covers new orders awaiting processing, whether advertising is active, and whether any alert appears on the Home page. This is meant as a practical suggestion rather than a fixed platform requirement.
Weekly dashboard review
A weekly session allows for a deeper look at advertising trends and cost per order in Sellvia Ads, traffic and order patterns in Reports, and how specific products are trending in Insights. This is a reasonable point to decide whether to adjust a budget or refine the product catalog.
Monthly account review
On a monthly basis, reviewing Billing, the current Plan and Performance Tier, payout history, and how funds are moving between Pending, Incoming, Available, and Risk Reserve provides a clearer picture of the complete operating result rather than just recent order activity.
The First 15 Minutes in a New Sellvia Dashboard
- Confirm the store status and its current URL.
- Review the Products section and the items already listed.
- Check whether Sellvia Ads is active or requires activation.
- Open Orders to see if anything needs processing.
- Read through the balance labels in My Account before assuming what any figure means.
- Review the current plan and any recent Billing entries.
- Locate Learn and Support in case a question comes up later.
None of these steps require purchasing an upgrade or activating a paid service immediately. Reviewing current conditions before committing to any added cost is a reasonable approach for a first session.
Metrics Beginners Should Not Confuse
A handful of distinctions account for most of the confusion new users report. Traffic is not the same as orders, since a visit does not guarantee a purchase. An order is not the same as a processed order, since processing is a required step before funds move forward. Gross sales are not the same as commission, since commission reflects only the markup earned. Commission is not the same as Available balance, since commission can include funds still Pending or in Incoming. Available balance is not the same as money already received in a bank account, since a payout still needs to be requested and completed. Advertising spend is not the same as complete operating cost, since subscription and processing fees also apply. Dashboard activity, overall, is not the same as net profit, which only appears after every cost is subtracted from earnings.
Common Dashboard Mistakes
Six mistakes account for most of the confusion beginners run into with the dashboard.
Looking only at total earnings. This figure reflects gross activity, not profit; checking the net operating result gives a far more honest picture
Ignoring unprocessed orders. Orders that sit too long without action are typically cancelled, which turns a completed sale into a missed one.
Treating every order as profit. Advertising cost, processing fees, and subscription charges all apply before an order becomes real profit.
Increasing advertising before checking unit economics. Raising a daily budget without first confirming that cost per order is reasonable can amplify a loss rather than a gain.
Confusing Commission balance with Available balance. A large Commission figure can still include money sitting in Pending, Incoming, or Risk Reserve.
Overlooking subscription or service charges. A store can look profitable on the Orders screen while quietly losing money once Billing is factored in.
Failing to review current payout conditions. Minimum thresholds, fees, and processing times can change, so checking Payouts before requesting a withdrawal avoids surprises.
Is the Sellvia Dashboard Good for Beginners?
For someone with no prior ecommerce or advertising experience, the dashboard’s structure genuinely helps. It provides visible order statuses instead of a blank inbox, separates financial stages instead of showing one lump sum, and keeps product, advertising, and reporting functions within reach of each other rather than scattered across unrelated tools. Support and Learn resources are also close at hand when something is unclear.
That structure does not remove the learning curve entirely. A beginner still needs to understand the difference between gross and net figures, the meaning of each balance stage, and the basic logic of comparing advertising cost against the orders it produces. The dashboard organizes this information clearly, but interpreting it correctly still takes a short period of attention and practice.
Final Verdict
The Sellvia dashboard’s strongest practical benefit is turning a set of separate business functions, store management, products, advertising, orders, reporting, balances, subscriptions, and payouts, into one structured operating environment. That matters most for a beginner who would otherwise need to move between a store platform, an advertising console, a spreadsheet, a payment dashboard, and separate subscription records just to understand how the business is actually doing.
The dashboard does not generate profit automatically, and viewing a report is not the same as improving a result. What it does provide is visibility: a place to see which orders need attention, whether advertising is working, and how earnings are progressing through each balance stage. The Sellvia dashboard is most valuable when it is treated as a decision-making workspace, not merely a screen that reports orders.
Frequently Asked Questions
What is the Sellvia Dashboard?
The Sellvia dashboard is the account portal used to operate a Sellvia-powered store after it has been set up. It brings together product management, advertising controls, order status, financial reports, and account settings in one place, so a store owner does not need to rely on separate external tools for each function. Availability of specific sections can vary depending on the account and its current subscription.
How do I access the Sellvia Dashboard?
Access is through the official Sellvia account portal using the login created during sign-up. Once logged in, a navigation menu typically appears on the left side of the screen, giving access to products, orders, advertising, reports, and account settings. If login issues occur, the Support section of the dashboard or Sellvia’s official help resources are the appropriate next step rather than third-party guides.
What can I manage from the Sellvia Dashboard?
A typical account can manage its product catalog, activate and monitor advertising campaigns, process customer orders, review performance reports, track financial balances, and handle subscription and payout details. The exact set of available tools can depend on the account’s Performance Tier and any additional services purchased.
Where can I see Sellvia orders?
Customer purchases appear in the Orders section of the dashboard, generally showing order status, purchase details, and whether processing is still required. Because unprocessed orders can be cancelled if left too long, this section benefits from regular review rather than occasional checking.
How does the Sellvia Ads dashboard work?
The Sellvia Ads section allows a user to activate advertising, add or manage advertising credit, and review campaign activity and performance indicators without needing a separate Google, Facebook, or TikTok account. Results should be judged over several days rather than a single day, since advertising systems typically need a short period to stabilize.
What is the difference between Pending, Incoming, and Available?
Pending generally refers to funds tied to orders that have not yet completed processing. Incoming refers to funds that have completed processing but remain in a temporary holding period. Available is the portion currently eligible for permitted uses or for payout. Current timelines and thresholds should be verified inside My Account, since they can change.
Where can I check Sellvia payouts?
Payout information, including withdrawal requests, available methods, associated fees, and current status, is generally found under the Payouts area within My Account. This section is separate from Billing, which tracks money the account has paid out rather than money withdrawn from earnings.
Where are subscription charges shown?
Subscription charges, credit purchases, and service fees typically appear under Billing within My Account, while the current plan and Performance Tier are shown under Plans. Reviewing both before a renewal date helps avoid unexpected charges.
Can Sellvia Balance be used to process orders?
Order processing is normally covered by a saved card or another accepted card for manual processing, or by Order Processing Credits when automatic processing is enabled and sufficiently funded. Current documentation also describes a final automatic attempt to process an order using Available balance before an unprocessed order is canceled after seven days, though this should not be relied on as the primary payment method. Checking the payment options shown in the current Orders section is the most reliable way to confirm what applies to a specific account.
Is the Sellvia Dashboard suitable for beginners?
Yes, with a short learning period. The dashboard’s structure, visible order statuses, separated balance stages, and centralized advertising and product tools are genuinely useful for someone new to online business. Beginners still need to learn the difference between gross and net figures and understand each balance stage to interpret the dashboard accurately.

Jeck Palmer is an ecommerce writer and platform researcher at Sellvia.info. He specializes in analyzing Sellvia’s features, pricing, tools, advertising system, order workflow, and overall business model. His articles are designed to explain complex platform processes in clear and practical language, helping beginners understand potential costs, evaluate available tools, and make more informed decisions before starting an online business.
the billing vs payouts distinction cleared up something i genuinely confused for weeks. was checking billing wondering where my withdrawal history was, wrong section the whole time
the insights section is actually underrated. found my best converting product through the best-sellers panel, wouldn’t have noticed it in the regular reports otherwise
this whole dashboard breakdown is nice but doesn’t change the fact that the home page summary is basically useless if you’re trying to figure out actual profit. it’s just a vibes screen
that’s literally what the article says though, it explicitly calls the home page a triage tool not a profit report
ok fair i skimmed that part, still wish the actual dashboard made that more obvious instead of needing a third party article to explain it
confirming commission balance is not the same as available balance is the single most important sentence in this entire piece. cost me two weeks of confusion before i understood that
this article is basically a manual sellvia should be handing out on day one instead of making people figure it out through trial and error
honestly the dashboard itself is fine, my issue is more that nobody explains WHY certain numbers are separated the way they are until you read something like this
the seven day auto-cancel on unprocessed orders is a detail that should be shouted from the rooftops. lost two orders early on because i didn’t know that clock was running
same thing happened to me. felt like such an avoidable loss once i understood what actually went wrong
That seven-day window caught me too – I had an unprocessed order sitting there on day six and only noticed because I happened to open the service dashboard on a Thursday evening after work. First week with the service was slower than I expected in terms of learning where everything lived, but that one close call taught me to check the orders tab daily without exception.
this whole dashboard system feels overcomplicated for what’s supposed to be a “beginner friendly” platform. shouldn’t need a 3000 word guide to understand where your own money is
any business with real order processing, ad spend, and payout timing is going to have some complexity. a lemonade stand is simple too but it also doesn’t make you money at scale
fair point, still think the platform itself could surface this info more clearly instead of relying on third party breakdowns like this one
the my account four-part breakdown (home, billing, payouts, plans) is exactly how i eventually organized my own weekly review routine after a few months of confusion
appreciate that this doesn’t oversell the dashboard as some magic profit calculator. it’s honest that you still have to do the thinking yourself
does the insights section actually update in real time or is it more of a weekly snapshot? trying to figure out how often it’s worth checking
felt more like a weekly-ish snapshot in my experience, wouldn’t check it obsessively daily, weekly seems like the right cadence
the “first 15 minutes” checklist at the end is genuinely useful, wish i’d had a structured version of this instead of just clicking around randomly on day one
solid writeup. the metrics section on what not to confuse should be pinned somewhere visible in the actual platform
At week 19 doing my own informal Sellvia review, I’d say that exact confusion between gross revenue and available balance cost me a full hour of re-checking my numbers before I accepted what the system was actually showing me – pinning that distinction inside the dashboard itself would have saved the embarrassment.
my only gripe is this makes the dashboard sound cleaner than it actually feels day to day, there’s some visual clutter that isn’t captured in a text description
fair, articles like this describe the logic and structure, not necessarily how polished the actual UI feels to use
the market and business valuation section is new info to me, didn’t realize that was even a dashboard feature on some accounts. curious how accurate that estimate actually is
mine shows an estimate but the article is right that it’s not a guaranteed sale price. treat it as a rough number, not gospel
genuinely one of the more useful sellvia articles i’ve read, most content online is either pure hype or pure rage, this is neither
The ad system was the actual surprise – I expected basic on/off controls but around day 60 I noticed the system was connecting ad performance directly to which products I reviewed, not just budget. What this article describes as separate sections genuinely do influence each other, and that took me longer than ten days to trust. Three people asked me this week what I was using, and the honest answer is I am still not fully sure I understand every layer of how the ads work – I just know the numbers held.
The deposit mechanic for auto-processing is the part most overviews underexplain – around day 44 I realized the balance sitting in the setup was doing operational work, not just sitting there waiting to be withdrawn. Before I funded that layer properly, I was still the manual step between an order and a processed order, which is exactly the kind of busy-not-productive pattern I was trying to escape. Once that clicked, the dashboard stopped being a place I checked and became a place I trusted.
Before what I’m using, I had four separate tabs open just to answer the question “did that order get processed” – a spreadsheet, an ad account, a store backend, and a payment portal running simultaneously. The article nails something I didn’t fully appreciate until about week 6: the value isn’t the menu count, it’s that a product decision visibly ripples into the orders screen and then into the balance. Centralized. That single connection cut my daily admin time in half and honestly made me feel less like I was managing chaos.
The part about connections between sections rather than memorizing labels is exactly where I stopped being a beginner – once I saw how an ad decision showed up in Reports and eventually moved money toward that $100 withdrawal threshold, the whole dashboard started reading like one sentence instead of separate paragraphs.
The Sellvia Market piece is the part I kept coming back to – knowing the store can get listed there after 60 days meant the setup had somewhere to grow into, not just somewhere to start.
The part about connections mattering more than memorizing labels hit exactly right – I was a complete beginner who had no idea what I was doing, and what I noticed first month wasn’t the menu structure, it was that the $40 ad coupon covered my first four days at $10 a day and a sale had already processed before I figured out where half the screens were.
The section on how the dashboard connects product decisions to orders to balance actually describes the moment I stopped checking it every hour – once I understood that flow, I trusted the thing to hold information without me watching it. Tbh that shift happened quietly, not dramatically.
The 14-day trial was enough for me to see one actual sale process and watch the balance update – well, not exactly a full picture, but enough to know the dashboard did what it claimed. Replacing three separate tools I was paying for with one $39 monthly subscription made the math easy.