

Sellvia Ads Metrics Explained: How to Read Traffic, Orders and Ad Performance
Quick Answer
Sellvia Ads metrics are most useful when you read them as a sequence rather than as isolated numbers. Traffic tells you whether ads are bringing people to the store. Orders tell you whether that traffic is turning into purchases. Ad spend tells you what it cost to generate those visits and orders. The practical goal is not to chase the largest traffic number, but to understand whether the money spent on ads is producing enough orders and usable margin to justify continuing, adjusting, or pausing a campaign.
A simple reading order is: spend -> traffic -> orders -> conversion -> cost per order -> economics. If traffic rises but orders do not, the issue is usually not solved by looking at traffic alone. If orders rise while cost per order stays within the amount the store can afford, the campaign is behaving more constructively.
Start With the Funnel, Not One Metric
An ads dashboard can make every number look equally important, but they answer different questions. First ask whether the campaign is delivering traffic. Second, whether visitors are buying. Third, whether those purchases make financial sense after advertising and other operating costs.
| Metric | What it tells you | What to ask next |
|---|---|---|
| Ad spend | How much budget has been consumed | What did that spend produce? |
| Traffic or visits | How many people reached the store | Did those visitors place orders? |
| Orders | How many purchases were generated | How much did each order cost to acquire? |
| Conversion rate | How efficiently visits became orders | Is the offer matching the traffic? |
| Cost per order | Advertising cost allocated to each order | Does the order economics support that cost? |
1. Read Ad Spend First
Spend gives the rest of the dashboard context. Ten visits generated from a very small amount of spend mean something different from ten visits generated after a much larger budget has already been consumed. Before judging traffic or orders, note how much money was actually spent during the period you are reviewing.
Sellvia’s available daily ad budget can increase over time, with approximate unlock levels around $10 at the start, $15 around day 5, $20 around day 10, $30 around day 20, and $50 around day 30 where those limits apply. A higher available budget is capacity, not a requirement to spend more. Increasing spend before the existing data makes sense can simply make an inefficient campaign lose money faster.
Compare similar periods when possible. A campaign that spent $10 should not be judged against another period that spent $50 as if the raw traffic and order totals were directly comparable.
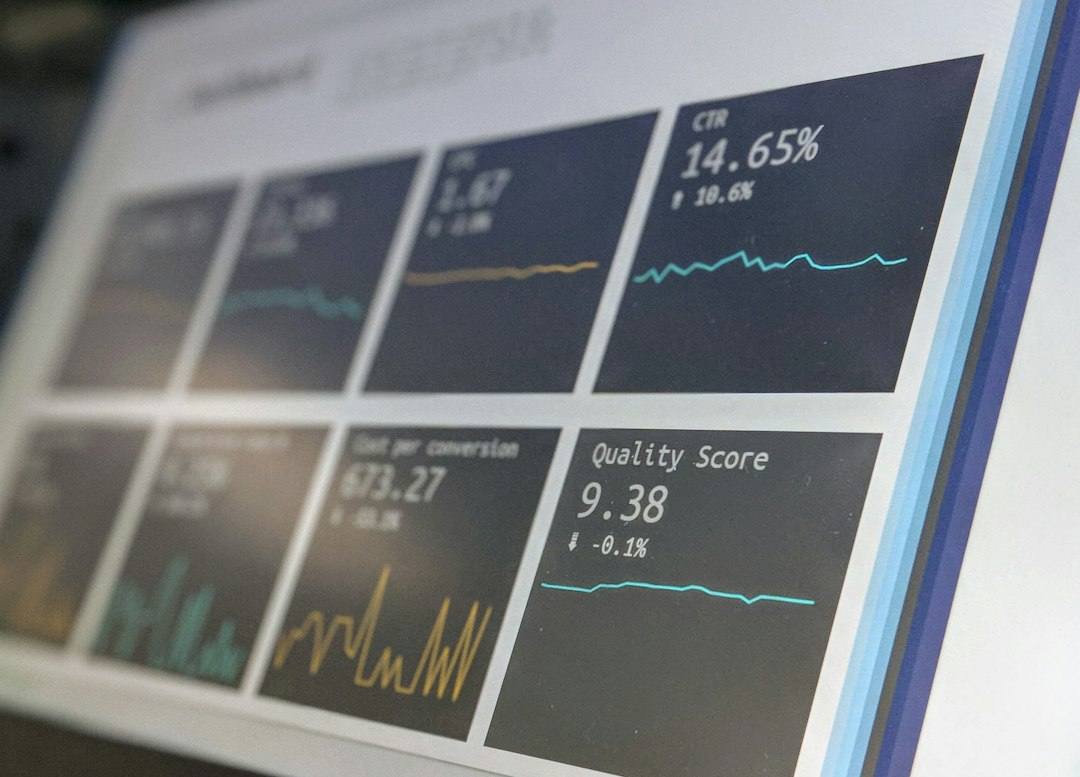
2. Traffic Shows Delivery, Not Profitability
Traffic is an early signal. If ads are spending but producing little or no traffic, there may be a delivery, targeting, creative, or measurement issue worth investigating. If traffic is arriving, the ad has at least succeeded in moving people from the ad to the store.
But traffic by itself is not a business result. If visits doubled while orders stayed flat, the additional visitors were less productive than the earlier traffic. If visits and orders increased together, the campaign may be scaling more cleanly. Traffic is therefore the top of the measurable funnel, not a substitute for sales performance.
3. Orders Connect Advertising to Revenue
Orders are the clearest bridge between ad activity and store activity. The raw order count becomes much more informative when paired with spend and traffic.
Imagine Campaign A spends $30, brings 150 visits, and generates 3 orders. Campaign B also spends $30, brings only 90 visits, but generates 5 orders. Looking only at traffic makes Campaign A appear stronger. Once orders are included, Campaign B is producing more purchases from the same ad spend. That does not automatically make it profitable because product economics still matter, but it shows why traffic and orders should always be read together.
4. Calculate Conversion Rate
Conversion rate describes the share of visitors who become customers. The basic calculation is:
Conversion rate = orders / visits x 100
Campaign A generated 3 orders from 150 visits, or 2%. Campaign B generated 5 orders from 90 visits, or about 5.6%. That difference tells you something the traffic totals hide: Campaign B’s visitors were much more likely to purchase.
Conversion rate should be interpreted cautiously when the sample is small. One additional order can move the percentage dramatically when there have only been a few dozen visits. Use conversion as a diagnostic metric alongside spend and orders rather than overreacting to every short-term change.
5. Calculate Cost Per Order
Cost per order connects spend directly to purchases:
Cost per order = ad spend / number of orders
If $30 in ad spend generates 3 orders, advertising cost per order is $10. If the same $30 generates 5 orders, it is $6. The second campaign is acquiring orders more efficiently on this measure.
However, a $6 cost per order is not automatically good and a $10 cost per order is not automatically bad. The store needs enough margin per order to absorb acquisition cost plus other operating costs. The correct threshold depends on the economics of the products being sold.
6. Separate Dashboard Performance From Cash Availability
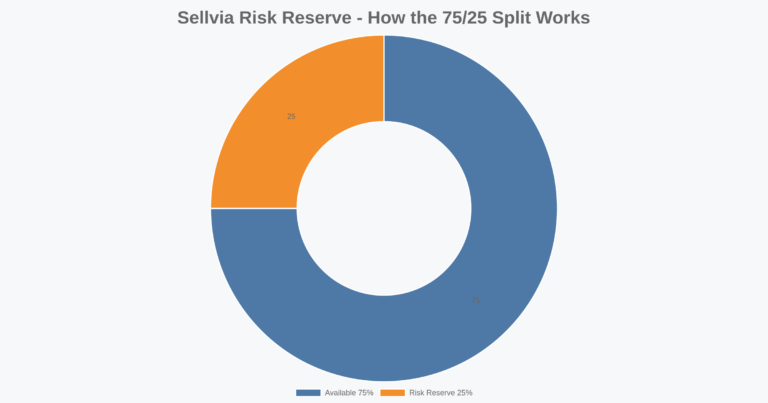
An order appearing in performance data does not mean all associated money is immediately available to withdraw or reuse. Under the current Sellvia flow, an order involves its processing cost and then moves through Pending and Incoming, with Incoming taking roughly 72 hours before funds become available. Approximately 75% can become Available while about 25% may be placed in Risk Reserve and released later, around 125 days.
This means a campaign can generate orders while the store still needs enough working capital to continue operating. Ad performance and cash availability are related, but they are not the same dashboard question. When evaluating whether to increase spend, consider both acquisition performance and the amount of cash actually available to support continued activity.
A Simple Daily Reading Routine
- Record how much the campaign spent during the period.
- Check whether that spend produced meaningful traffic.
- Compare traffic with the number of orders.
- Calculate conversion rate when enough visits exist to make the comparison useful.
- Calculate cost per order.
- Compare cost per order with the margin the store can realistically afford.
- Check whether available cash can support continued processing and advertising.
- Only then decide whether the campaign needs more time, an adjustment, a pause, or a higher budget.

How to Interpret Common Patterns
Spend with almost no traffic: investigate delivery or campaign setup before drawing conclusions about the store offer.
Traffic with no orders: the ad may be attracting clicks without enough purchase intent, or the offer and landing experience may not be converting those visitors.
Orders with a high cost per order: sales are occurring, but acquisition efficiency may not support the store’s margin.
Orders with a stable or falling cost per order: this is generally a more useful scaling signal than traffic growth alone, provided the underlying order economics remain viable.
Good order performance but tight available cash: treat this as a cash-flow constraint rather than assuming the ad itself is failing. Sellvia’s payout timing and reserve mechanics can make operating liquidity important even when orders are coming in.
What the Ads Dashboard Cannot Tell You by Itself
No single dashboard number can answer whether a store is profitable. Ad metrics describe acquisition activity. To evaluate the business result, combine them with product margin, processing costs, subscription and tier costs where applicable, payout costs, and the timing of available funds.
The base Sellvia subscription is currently $39 per month. Weekly performance tiers can add cost depending on the level used: Plus $19 for up to 100 orders, Advanced $39 for up to 250, Pro $69 for up to 500, and Elite $99 with unlimited orders. Those costs do not belong inside the ad dashboard itself, but they matter when moving from campaign analysis to full store economics.
Bottom Line
The cleanest way to read Sellvia Ads performance is to move through the funnel in order: how much was spent, how much traffic arrived, how many orders resulted, how efficiently visitors converted, and what each acquired order cost. Then compare that acquisition cost with the actual economics and cash-flow requirements of the store.
Traffic is useful evidence that ads are delivering. Orders show that visitors are buying. Cost per order shows how expensive those purchases were to acquire. None of those numbers should be interpreted alone. Read together, they provide a much clearer basis for deciding what to keep, what to adjust, and when increasing the ad budget actually makes sense.

Jeck Palmer is an ecommerce writer and platform researcher at Sellvia.info. He specializes in analyzing Sellvia’s features, pricing, tools, advertising system, order workflow, and overall business model. His articles are designed to explain complex platform processes in clear and practical language, helping beginners understand potential costs, evaluate available tools, and make more informed decisions before starting an online business.

The part of every Sellvia review I never saw anyone explain clearly is that the 60-day mark before your store can be listed on Sellvia Market is not a delay – it is actually a window to get the ad data clean enough that the listing means something real.